Python绘制3D图形-1
Just make it easier, easier to understand and beautiful!
一、基础篇
Python绘图包括了2D和3D,不同的类型使用的库不同,本系列主要讲3D图形的绘制。包括3D曲面图、3D散点图以及在3D曲面图上绘制有向、无向线。
1.1 环境说明
本文中软件运行环境如下:
| 项 | 参考值 | 备注 |
|---|---|---|
| OS | Win7_X64 | 旗舰版 |
| Python | 3.4.3 | 32bit版 |
| IDE | WinPython-32bit | 3.4.3.7Qt5 |
1.2 3D曲面图
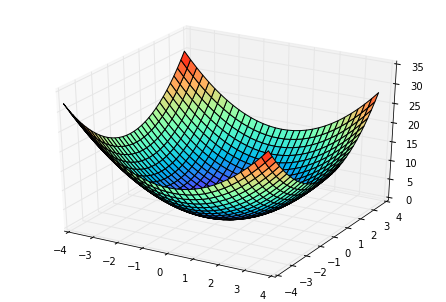
3D曲面和散点的绘制用的都是mpl_toolkits库的mplot3d模块中的Axes3D来完成。曲面的绘制调用的是函数plot_surface()。下述代码将绘制一个3D锥面。1
2
3
4
5
6
7
8
9
10
11
12
13
14
15
16
17
18
19
20
21
22
23
24
25
26
27
28
29# -*- coding: utf-8 -*-
"""
Created on Mon May 8 12:20:29 2017
@author: flat2010
"""
import numpy as np
from matplotlib import pyplot as plt
from mpl_toolkits.mplot3d import Axes3D
# 创建3D对象
fig = plt.figure()
ax = Axes3D(fig)
# 分别生成x、y坐标数据
xcord = np.arange(-5, 5, 0.2)
ycord = np.arange(-5, 5, 0.2)
# 将坐标向量转换成坐标矩阵(vectors -> matrices)
xcord, ycord = np.meshgrid(xcord, ycord)
# 生成z坐标数据
r = np.sqrt(xcord**2 + ycord**2)
zcord = r
# 绘制曲面图
ax.plot_surface(xcord, ycord, zcord, rstride=1, cstride=1, cmap='rainbow')
plt.show()
绘制成的图形如下图1-1所示:
Axes3D.plot_surface(X, Y, Z, *args, **kwargs)函数的常用参数官方解释如下:
| 参数名 | 英文说明 | 中文解释 |
|---|---|---|
| X, Y, Z | Data values as 2D arrays | x、y、z三个坐标轴的数据,均为二维数组 |
| rstride | Array row stride (step size) | 二维数组行增量,如该值取2时,二维数组中只有序号为0、2、4···的数据才会被绘制 |
| lstride | Array row ltride (step size) | 二维数组列增量,作用同rstride |
| color | Color of the surface patches | 曲面图中像素块的颜色,如果同时设置了cmap参数该值会被cmap覆盖 |
| cmap | A colormap for the surface patches | 曲面图中像素块的颜色图,可提供多个值 |
| cmap | A colormap for the surface patches | 曲面图中像素块的颜色图,可提供多个值 |
| facecolors | Face colors for the individual patches | 指定像素块的颜色,二维数组[rs][cs] |
| norm | An instance of Normalize to map values to colors | Normalize(标准化)对象,负责将不同的值映射为不同的颜色 |
| vmin | Minimum value to map | 规范化的最小值 |
| vmax | Maximum value to map | 规范化的最小值 |
| shade | Whether to shade the facecolors | 是否屏蔽facecolors |
1.3 3D散点图
3D散点图和3D曲面图有所不同的是,创建绘图对象时,使用的是add_subplot()函数(实测使用Axes3D也可以),代码如下:1
2
3
4
5
6
7
8
9
10
11
12
13
14
15
16
17
18
19
20
21
22
23
24
25
26
27
28
29
30# -*- coding: utf-8 -*-
"""
Created on Mon May 8 12:20:29 2017
@author: flat2010
"""
import numpy as np
from matplotlib import pyplot as plt
from mpl_toolkits.mplot3d import Axes3D
# 创建3D对象
fig = plt.figure()
ax = fig.add_subplot(111, projection='3d')
# 分别生成x、y坐标数据
xcord = np.arange(-5, 5, 0.5)
ycord = np.arange(-5, 5, 0.5)
# 将坐标向量转换成坐标矩阵(vectors -> matrices)
xcord, ycord = np.meshgrid(xcord, ycord)
# 生成z坐标数据
r = np.sqrt(xcord**2 + ycord**2)
zcord = r
# 绘制散点图,将图形分成两部分,用不同颜色绘制
ax.scatter(xcord[:10], ycord[:10], zcord[:10], c='r')
ax.scatter(xcord[10:], ycord[10:], zcord[10:], c='g')
plt.show()
坐标点的数据仍然是上面的3D圆锥面。绘制形成的图形如下所示: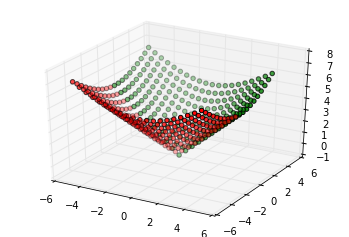
Axes3D.scatter(xs, ys, zs=0, zdir=’z’, s=20, c=’b’, *args, **kwargs)函数的常用参数官方解释如下:
| 参数名 | 英文说明 | 中文解释 |
|---|---|---|
| xs, ys | Positions of data points | x、y两个个坐标轴的数据 |
| zs | Either an array of the same length as xs and ys or a single value to place all points in the same plane. Default is 0 | z轴数据,即可以是数组(与x、y等长),也可以是一个数字(即为二维图形) |
| zdir | Which direction to use as z (‘x’, ‘y’ or ‘z’) when plotting a 2D set | 若提供的是一个二维数据集时,使用哪个方向的数据作为z轴数据 |
| s | size in points^2. It is a scalar or an array of the same length as x and y | 数据点在图中的显示大小(标量或与x、y等维度的向量) |
| c | a color. c can be a single color format string, or a sequence of color specifications of length N, or a sequence of N numbers to be mapped to colors using the cmap and norm specified via kwargs (see below)… | 数据点颜色,即可以是字符串形式的标量,也可以是长度N的颜色序列,也可以是通过cmap或norm映射的长度为N的颜色序列,但不能是单个RGB值或序列,可以是二维数组。 |
1.4 其它图
该模块还提供了其它的一些常见图形,如:
- Axes3D.plot(xs, ys, *args, **kwargs)即曲线图;
- Axes3D.plot_trisurf(*args, **kwargs)即三曲面图;
- Axes3D.contour(X, Y, Z, *args, **kwargs)即轮廓图;
- Axes3D.add_collection3d(col, zs=0, zdir=’z’)即多边形图
- Axes3D.bar(left, height, zs=0, zdir=’z’, *args, **kwargs)即直方图。
详细用法及说明可参见matplot官方文档。